Post a Free Blog

Submit A Press Release

Generic selectors
Exact matches only
Search in title
Search in content
Post Type Selectors
Filter by Categories
Action
Animation
ATP Tour (ATP)
Auto Racing
Baseball
Basketball
Boxing
Breaking News
Business
Business
Business Newsletter
Call of Duty (CALLOFDUTY)
Canadian Football League (CFL)
Car
Celebrity
Champions Tour (CHAMP)
Comedy
CONCACAF
Counter Strike Global Offensive (CSGO)
Crime
Dark Comedy
Defense of the Ancients (DOTA)
Documentary and Foreign
Drama
eSports
European Tour (EPGA)
Fashion
FIFA
FIFA Women’s World Cup (WWC)
FIFA World Cup (FIFA)
Fighting
Football
Formula 1 (F1)
Fortnite
Golf
Health
Hockey
Horror
IndyCar Series (INDY)
International Friendly (FRIENDLY)
Kids & Family
League of Legends (LOL)
LPGA
Madden
Major League Baseball (MLB)
Mixed Martial Arts (MMA)
MLS
Movie and Music
Movie Trailers
Music
Mystery
NASCAR Cup Series (NAS)
National Basketball Association (NBA)
National Football League (NFL)
National Hockey League (NHL)
National Women's Soccer (NWSL)
NBA Development League (NBAGL)
NBA2K
NCAA Baseball (NCAABBL)
NCAA Basketball (NCAAB)
NCAA Football (NCAAF)
NCAA Hockey (NCAAH)
Olympic Mens (OLYHKYM)
Other
Other Sports
Overwatch
PGA
Politics
Premier League (PREM)
Romance
Sci-Fi
Science
Soccer
Sports
Sports
Technology
Tennis
Thriller
Truck Series (TRUCK)
True Crime
Ultimate Fighting Championship (UFC)
Uncategorized
US
Valorant
Western
Women’s National Basketball Association (WNBA)
Women’s NCAA Basketball (WNCAAB)
World
World Cup Qualifier (WORLDCUP)
WTA Tour (WTA)
Xfinity (XFT)
XFL
0
-- Advertisement --spot_img
HomeBusinessXPO Logistics: A Comprehensive Financial Analysis

XPO Logistics: A Comprehensive Financial Analysis

Add to Favorite
Added to Favorite


Earnings per share (EPS) of $0.792 fell short of the estimated $0.89, indicating a miss in earnings expectations.
Revenue of $2.053 billion surpassed the estimated $2.020 billion, showcasing higher-than-anticipated revenue generation.
Significant financial metrics include a price-to-earnings (P/E) ratio of 37.7 and a debt-to-equity ratio of 2.53, reflecting investor confidence and significant use of debt.

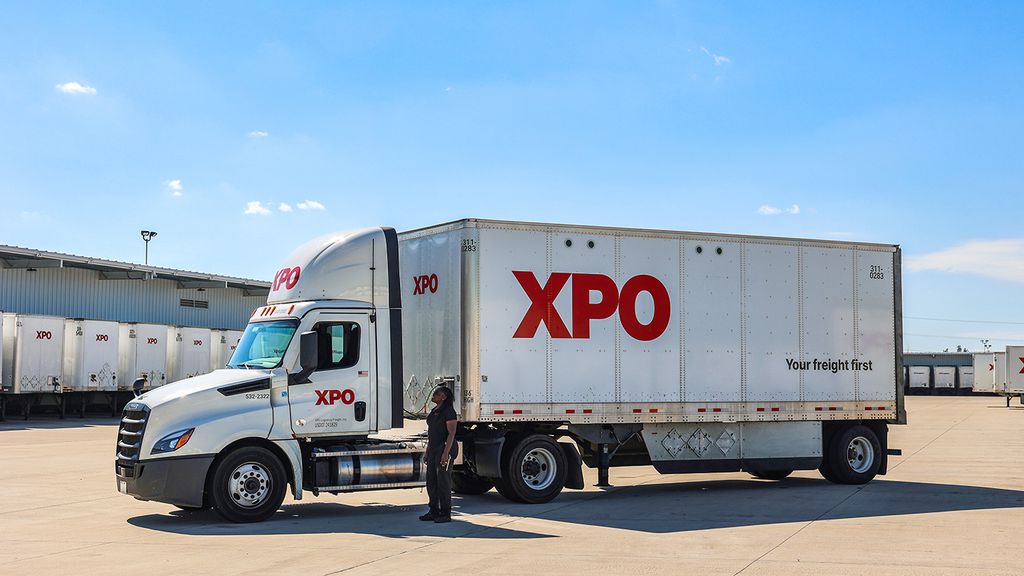
XPO, listed on the New York Stock Exchange as NYSE:XPO, is a prominent player in the logistics and transportation sector. The company provides supply chain solutions, including freight transportation and last-mile delivery services. XPO competes with other logistics giants like FedEx and UPS, striving to maintain its position in a highly competitive market.

On October 30, 2024, XPO reported earnings per share (EPS) of $0.792, which fell short of the estimated $0.89. Despite this, the company’s revenue for the period was $2.053 billion, surpassing the estimated $2.020 billion. This indicates that while earnings were below expectations, XPO managed to generate higher-than-anticipated revenue.

XPO’s financial results for the third quarter of 2024 show a positive trend. The company reported diluted earnings from continuing operations per share of $0.79, up from $0.72 in the same period of 2023. Additionally, adjusted diluted earnings from continuing operations per share increased to $1.02, compared to $0.88 in the previous year, highlighting growth in earnings.

The company’s financial metrics provide further insight into its performance. XPO has a price-to-earnings (P/E) ratio of 37.7, indicating investor confidence in its earnings potential. The price-to-sales ratio of 1.73 suggests the market values its sales at 1.73 times its revenue. The enterprise value to sales ratio is 2.20, reflecting the company’s total valuation compared to its sales.

XPO’s financial health is also evident in its enterprise value to operating cash flow ratio of 20.46, showing how its valuation compares to cash flow from operations. With an earnings yield of 2.65%, XPO offers a return of 2.65% on its earnings relative to its share price. The debt-to-equity ratio of 2.53 indicates significant use of debt, while a current ratio of 1.06 suggests the company can cover its short-term obligations.

Subscribe to get Latest News Updates

Latest News

You may like more
more

Arch Capital Group’s Market Outlook and Financial Performance

Michael Zaremski from Capital One Financial set a price...

Jazz Pharmaceuticals’ Financial and Operational Highlights

Earnings per Share (EPS) of $3.40, missing the estimated...

Clarivate Plc (NYSE:CLVT) Q3 Earnings Overview

Clarivate Plc reported a Q3 EPS of -$0.09128, missing...

Clean Energy Fuels Corp. (NASDAQ: CLNE) Financial Performance Review

Clean Energy Fuels Corp. (NASDAQ:CLNE) reported a revenue of...