Price-to-Earnings (P/E) ratio stands at approximately 20.89, indicating market optimism.
Price-to-Sales (P/S) ratio of about 1.79 suggests a solid market position relative to revenue generation capabilities.
Debt-to-Equity (D/E) ratio of roughly 0.61 shows a moderate reliance on debt financing, balancing growth and financial stability.
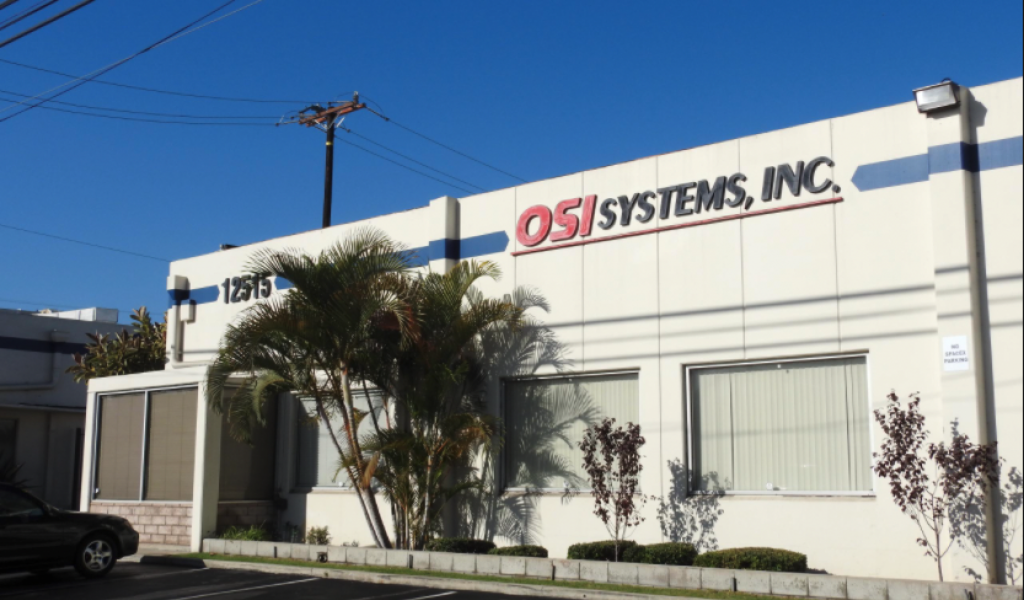
OSI Systems, Inc. (NASDAQ:OSIS) recently shared its fourth-quarter earnings, shedding light on its financial performance as of June 2024. While the exact revenue and EPS figures were not provided, understanding these metrics in relation to Wall Street’s expectations and the company’s past performance is key. This comparison helps gauge OSI Systems’ growth trajectory and its success in aligning with investor anticipations. OSI Systems operates in the security and inspection systems industry, competing with other firms to provide advanced security solutions across various sectors.
The company’s financial health can be further dissected through its price-to-earnings (P/E) ratio, which stands at approximately 20.89. This ratio indicates that investors are willing to pay $20.89 for every dollar of OSIS’s earnings, highlighting the market’s optimism about its future profitability. The price-to-sales (P/S) ratio of about 1.79 further demonstrates the value investors place on the company’s sales, suggesting a solid market position relative to its revenue generation capabilities.
Another critical metric, the enterprise value-to-sales (EV/Sales) ratio, is roughly 2.07 for OSIS. This figure offers a broader perspective on the company’s valuation by considering its debt and cash levels in relation to its sales. It underscores the market’s valuation of every dollar of OSI Systems’ sales, factoring in its financial structure. Additionally, the earnings yield of approximately 4.79% provides an insight into the potential return on investment, indicating a favorable yield for investors.
The company’s financial leverage and liquidity are also vital indicators of its fiscal health. With a debt-to-equity (D/E) ratio of about 0.61, OSI Systems shows a moderate reliance on debt financing, balancing between leveraging debt for growth and maintaining financial stability. The current ratio, sitting at around 1.47, suggests that the company is well-positioned to cover its short-term liabilities with its short-term assets, indicating good liquidity and financial resilience. These metrics collectively offer a comprehensive view of OSI Systems’ financial standing, providing investors with the necessary information to assess its investment potential.

