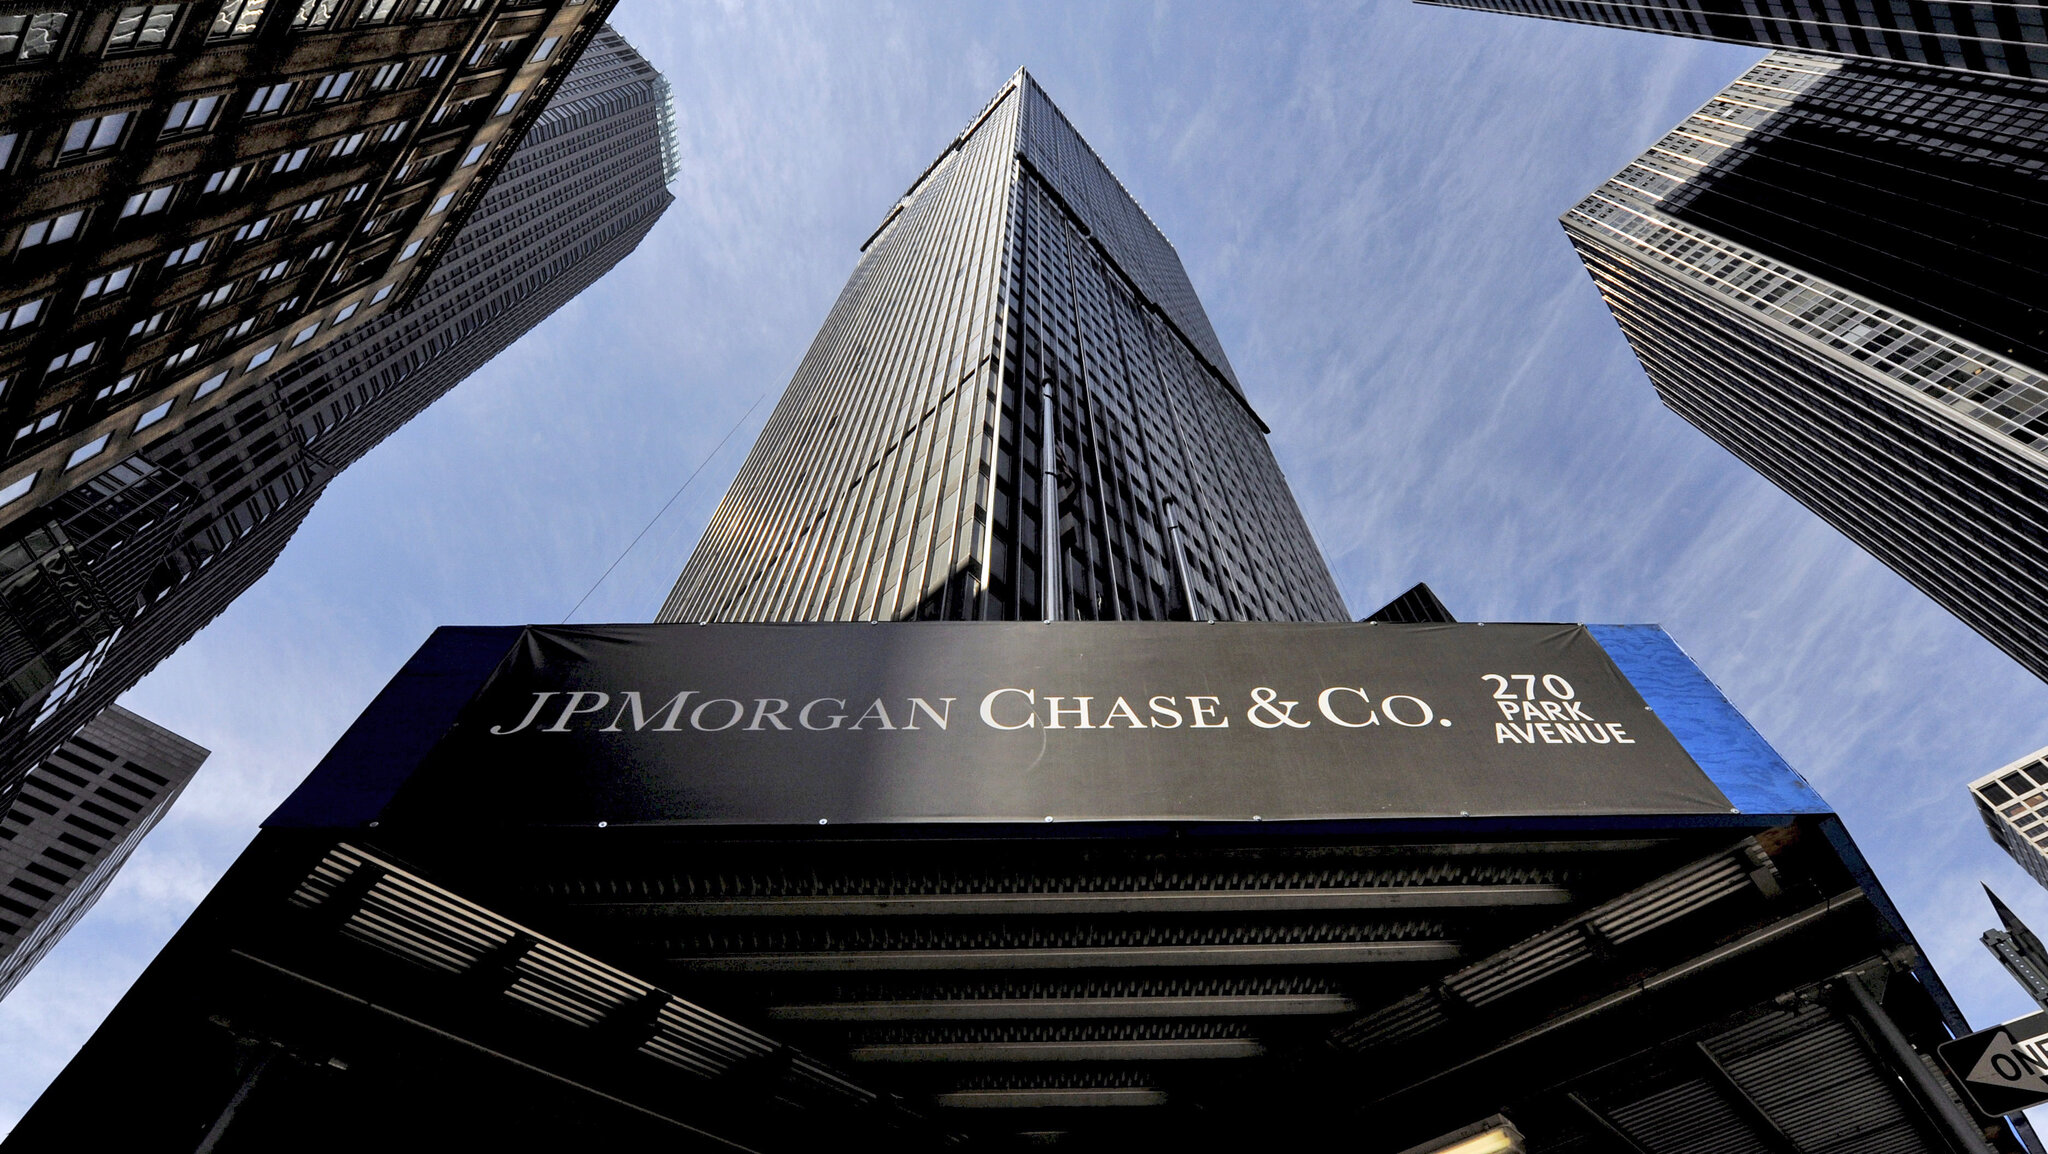
JPMorgan Chase & Co. (NYSE:JPM) has a Return on Invested Capital (ROIC) of 7.84% and a Weighted Average Cost of Capital (WACC) of 11.58%, indicating it does not generate returns exceeding its cost of capital.
Compared to its peers, JPMorgan Chase shows a higher ROIC to WACC ratio than Citigroup Inc. and Bank of America Corporation, suggesting better financial efficiency among the group.
Wells Fargo & Company outperforms JPMorgan Chase and other competitors with the highest ROIC to WACC ratio, indicating the most efficient capital utilization among the compared financial institutions.
JPMorgan Chase & Co. (NYSE:JPM) is a leading global financial services firm with operations worldwide. It provides a wide range of services, including investment banking, financial services for consumers and small businesses, commercial banking, financial transaction processing, and asset management. As one of the largest banks in the United States, JPMorgan Chase competes with other major financial institutions like Citigroup Inc., Bank of America Corporation, Wells Fargo & Company, and The Goldman Sachs Group, Inc.
In evaluating JPMorgan Chase’s financial performance, the Return on Invested Capital (ROIC) and Weighted Average Cost of Capital (WACC) are crucial metrics. JPM’s ROIC stands at 7.84%, while its WACC is 11.58%, resulting in a ROIC to WACC ratio of 0.68. This indicates that JPMorgan Chase is not currently generating returns that exceed its cost of capital, which is a critical measure of financial efficiency.
When comparing JPMorgan Chase to its peers, Citigroup Inc. has a ROIC of 0.89% and a WACC of 16.65%, leading to a ROIC to WACC ratio of 0.05. This suggests that Citigroup is less efficient in generating returns relative to its cost of capital compared to JPM. Similarly, Bank of America Corporation has a ROIC of 3.70% and a WACC of 14.96%, resulting in a ROIC to WACC ratio of 0.25, which is also lower than JPM’s ratio.
Wells Fargo & Company, with a ROIC of 5.46% and a WACC of 10.72%, achieves a ROIC to WACC ratio of 0.51. Although this ratio is less than 1, indicating that Wells Fargo is not generating returns above its cost of capital, it is the highest among the peers listed. This suggests that Wells Fargo is relatively more efficient in capital utilization compared to others in the group.
The Goldman Sachs Group, Inc. and The Boeing Company also show lower ROIC to WACC ratios of 0.20 and -2.22, respectively. Goldman Sachs has a ROIC of 2.66% and a WACC of 13.26%, while Boeing’s negative ROIC of -19.21% against a WACC of 8.64% highlights significant inefficiencies. Despite these challenges, Wells Fargo’s performance stands out among its peers, showcasing the best capital efficiency in this analysis.

